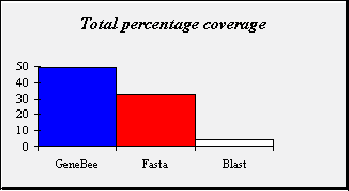
COMPARISION SENSITIVITY of the GENEBEE SEARCH, BLAST and FASTA programs
The approach for estimation of the homology search program sensitivity in nucleotide case was proposed in paper I.Anderson, A.Brass, "Searching DNA databases for similarities to DNA sequences: when is a match significant?", Bioinformatics, Vol. 14, pp. 349-356, 1998. Ten different nucleotide "seed" sequences were chosen. Three seed sequences were chosen to reflect different protein structure and different length of sequence so as to remove as far as bias in the test set. Three sequences were chosen accordingly to secondary structure classification of the corresponding protein (either all a-helices, all b-sheets, or both a-helices and b-sheets). Seven sequences were chosen to have length varying from 100 to 1000 bp. The Program RepeatMasker was used to ensure that the seed sequences were free from interspersed repeats and low-complexity regions. The Evolve program was used to generate 10 new sequences at a specific PAM distance from the seed sequences.
 |
Sets of sequences were generated at distances of 25, 50, 75, 100, 125, 150, 175, 200, 225 and 250 PAM from each of the seed sequences. In total. There were therefore 1000 sequences in the artificially created test set, 100 sequences being generated from each of the 10 seed sequences. Each of the 1000 artificially evolved sequences was used as a query for database search with Genebee search, blast-2.0.8 and fasta-3.3 as search engine. All programs run with default parameters. For each database search , the top hit was labeled as correct. The coverage of the database searches was defined as the percentage of correct top hit out of all the searches carried out. |
| Percentage coverage with the dependence on sequence length and types |
Sequence length
or types | 100 | 150 | 200 | 400 | 600 | 800 | 1000 | cntf | rbp | tyr |
| GeneBee | 18.0 | 32.0 | 35.4 | 47.0 | 52.5 | 65.0 | 66.0 | 57.0 | 64.0 | 55.1 |
| Fasta | 12.0 | 17.0 | 29.3 | 34.0 | 39.0 | 44.0 | 36.0 | 31.0 | 35.0 | 43.9 |
| Blast 2.0 | 1.0 | 1.0 | 2.0 | 3.0 | 5.0 | 12.0 | 7.0 | 4.0 | 6.0 | 4.1 |

| Percentage coverage with the dependence on PAM distance |
| PAM distance | 25 | 50 | 75 | 100 | 125 | 150 | 175 | 200 | 225 | 250 |
| GeneBee | 100.0 | 95.0 | 85.0 | 78.0 | 64.0 | 44.0 | 18.8 | 5.0 | 3.0 | 0.0 |
| Fasta | 87.8 | 76.0 | 59.0 | 50.0 | 30.0 | 12.0 | 5.0 | 0.0 | 2.0 | 0.0 |
| Blast 2.0 | 36.7 | 7.0 | 2.0 | 0.0 | 0.0 | 0.0 | 0.0 | 0.0 | 0.0 | 0.0 |

|


